Basics
This page contains:
I. Basics- What am I looking at?
II. Charts- Entries and Exits
III. De-coupling, Fibonacci Retracements and Growing Waves
IV. Resources- software, links, etc.
Basics: How to Understand My Charts
II. Charts: Entries and Exits
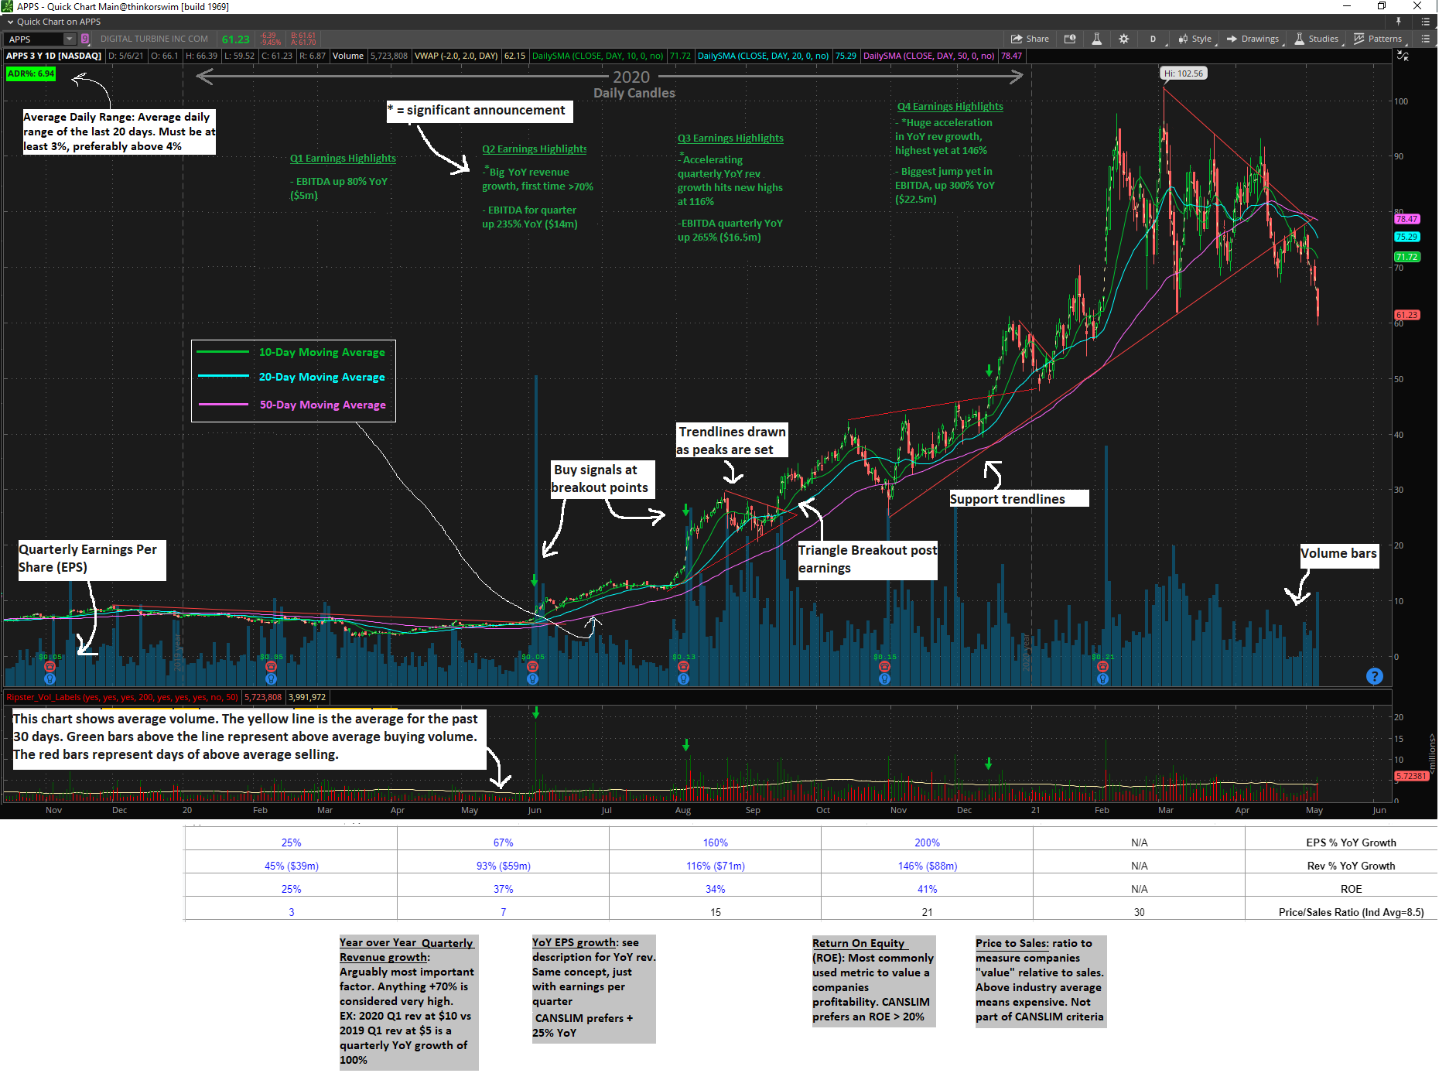
[ "The number one market leader is not the largest company or the one with the most recognized brand name; it’s the one with the best quarterly and annual earnings growth, return on equity, profit margins, sales growth, and price action." (William O'Neal) ]
Simply put my objective is to combine fundamentals with technicals by buying great companies at the rigth time. I look to buy companies with growing YoY revenue that are in strong uptrends and breaking out of clean uniform trendline patterns. Respecting key moving averages (such as the 10/20/50 daily moving average, or DMA) is critical, along with high volume and relative strength of the overall market. Contrary to what many might expect, I believe cheap stocks get cheaper, and expensive stocks become even more expensive as funds and momentum rush into them. Basically, buy high then sell higher, and avoid stocks that are in downtrends.
[ "It is one of the great paradoxes of the stock market that what seems too high usually goes higher and what seems too low usually goes lower." (William O'Neal) ]
Risk Management is paramount to all else. You must respect risk, keep stops tight and calculate the profit or loss for every trade before you enter. A disciplined system should be employed in order to remove emotions from the equation. Trades should also have worthwhile Risk-to-Reward ratios, and losses must be kept small in order to last. It is perfectably fine to take frequent, small papercuts on trades that dont take off. If you are able to keep your stop-outs at a fraction of what your gains are (say 1:6), you only need to be right a fraction of the time. The goal is to minimize losses when things go against you.
[ "The whole secret to winning big in the stock market is not to be right all the time, but to lose the least amount possible when you’re wrong." (William O'Neal) ]
[ "Those who are unwilling to accept small losses will soon be forced to accept large ones" (Mark Minervini) ]
________________________________________________
The charts below illustrate the text-book breakout patterns that I am going after. Ideally, the first and largest position is initiated right as price break outs of the point of the triangle with above average volume (also where the initial stop is placed). Additional, smaller purchases are made as the breakout is confirmed (referred to as "Pyramid-ing into a position"). Green arrows represent ideal break out entry spots. Take note of strong respect of the DMA's, above average volume days, and trendline breakouts. A volatile breach of a key moving average is usually how the ride ends. Never average down.
(All of these chart settings can be easily loaded into your ThinkorSwim app if you go to the "Resources" section at the bottom of this page and copy the ToS links.)
_____________________________________________________
III. De-coupling, Fibonacci Retracements and Growing Waves
[ "There is a time to be aggresive, a time to be cautious, and a time to go fish" (William O'Neal) ]
A large part of swing trading is recognizing the overall market trend and comparing the relative strength of the SPY to your basket of stocks. Are they doing worse or better than the SPY? After growth names experience big runs, often a decoupling effect takes place. This is when the SPY will start to taper sideways or dip a little while at the same time, growth names get slammed down. Most recently, on 2/8/21 we saw this take place. The image below shows how when the SPY dipped down to $378 for a 3% loss, the IWO (Growth ETF) took a significant hit, dropping 18% down to $277. Following a recovery on 3/5/21 the SPY has gone up, while the IWO has gone into a chop zone, residing at basically the same point with no gains. This is referred to as "De-coupling" from the Index. Investors in this period will often see a green day on the SPY then deal with confusion and frustration of opening their portfolios only to see a big fat negative daily P/L number on their individual growth holdings. If buying does not ensue on these beaten down names, while another industry starts making new highs, we must consider whether a true "rotation out of growth" has occured, or if it is just a buying opportunity as a result of others selling to ring the register on their growth stock gains.
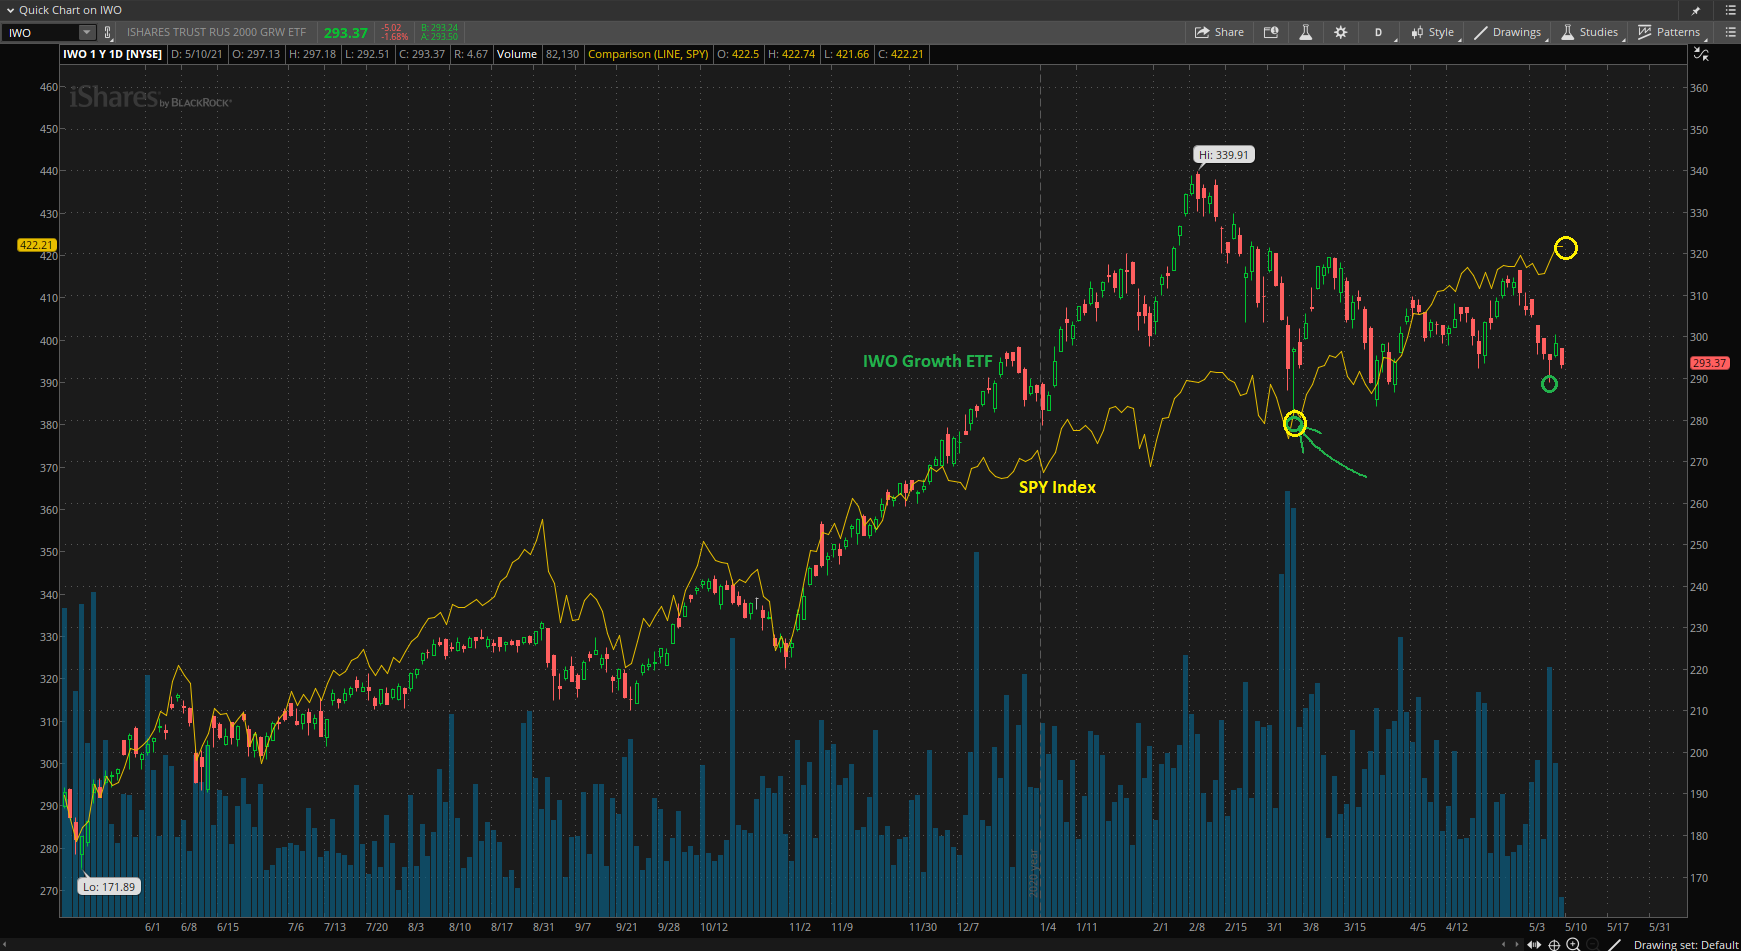
When the IWO is in this area, many names will set up as if they were breaking out, then get slammed down a few days later. It is very hard to make money in this environment. This is the time when most new traders give back all the gains (and then some) from the previous market run-up that they had just profited from. It is arguably the WORSE time to attempt trades. In a downtrending bear market, it is easy to stay away, as there is no temptation to buy stocks that are in free fall. When the IWO is in this triangle chop area however, breakouts are constantly setting up and luring you in, only to turn around and stop you out the next day. You must learn to recognize this period and figure out how to play defense. It is perfectly OK to pick up your ball and simply leave the court. This is often better than trying to fight the chop which can end up killing your account by a thousand paper cuts. You MUST above all else, recognize this period and do everything in your power to preserve the gains you had just made in the most recent market run-up.
_________________________________________________________
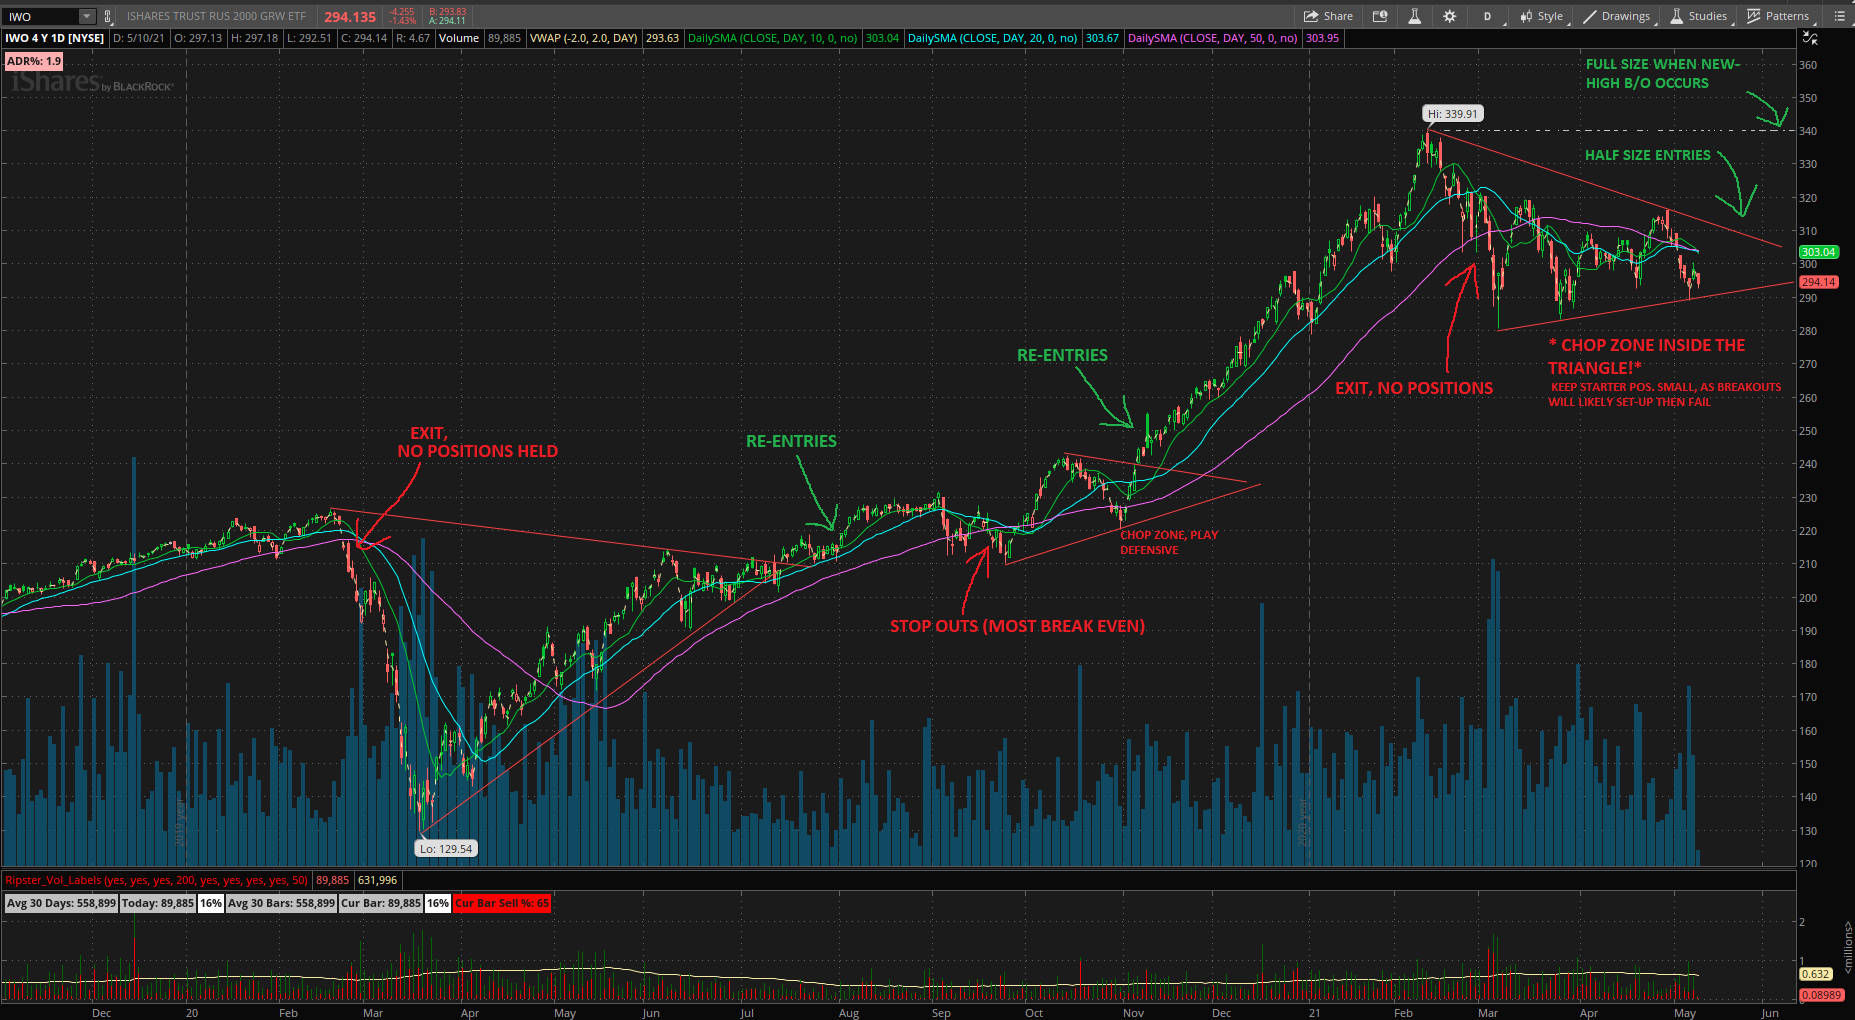
The image below shows the IWO Growth ETF. This is a good indicator of when your foot should be on and off the gas pedal with growth names. When the IWO's daily bars are above the 20-day moving average line (blue line), and the 20-day MA is above the 50-day MA (purple line), we are in bullish, full size environment. When the bars of the IWO plunge below the 50-day MA line, we should be extremely cautious and exit recent swing-trading positions. Selling long term profitable positions should be strongly considered in order to raise cash to buy back more of the same shares at a lower price. There are typically only 1-3 of these events a year. Following the plunge will be the period of price discovery. Let the chart patters draw themselves first at this point. We can enter when patterns are established and then breached. Growth names are currently sitting inside of a large triangle as seen on the chart of IWO.
_________________________________________________________
Fibonacci and Growing Waves
Coming soon...
(Big triangles get bigger... )
_________________________________________________________
IV. Resources
This section contains all the links you would need to start trading. These are THE ONLY tools/sites that I use.
1) SOFTWARE:
- Thinkorswim. This is a FREE charting platform that offers fantastic tools. You can make an account for free at TDAmeritrade in order to log on. Does not require any deposits or personal info.
Links for ToS: Just click settings, then "open shared item" within ToS, then paste these links. This will give you all of my layouts, studies and tools exactly like you've seen on my website.
Overal charts and workspace settings: https://tos.mx/Zlu9611
Scan for stocks above 10-DMA: https://tos.mx/GDaIkFW
Scan for stocks recently dipped below 7/10-DMA: http://tos.mx/JSJXobD
2) WEBSITES FOR FUNDAMENTAL SCREENING:
- Zacks for YoY Rev data: https://www.zacks.com/stock/chart/AAPL/fundamental/revenue-quarterly-yoy-growth
- Zacks for increasing EPS and sales scan: https://www.zacks.com/screening/stock-screener?icid=screening-screening-nav_tracking-zcom-main_menu_wrapper-stock_screener
- Marketbeat for est. vs actual EPS and Rev beats: https://www.marketbeat.com/stocks/NASDAQ/APPS/earnings/
- General screening: Finviz.com
- Institutional/Fund data: Whalewisdom.com
3) TWITTER:
- Even if you hate social media, the twitter users below are must follows who will provide invaluable CANSLIM insights as well as fresh trade ideas. Making a twitter account and only following these names would create an excellent feed worth checking every day.
https://twitter.com/RichardMoglen * (hosts interviews with all of the top CANSLIM traders)
https://twitter.com/markminervini * (current 2021 Investing Championship leader w/ 178% gains)
https://twitter.com/1charts6 * (1st place winner of 2020 Investing Championship w/ 941% return)
https://twitter.com/LeifSoreide * (1st place winner of 2019 Investing Championship)
https://twitter.com/Qullamaggie * (live trading breakouts/high tight flags everyday on twitch)
https://twitter.com/PatternProfits * (excellent CANSLIM watchlists)
https://twitter.com/TraderAmogh * (CANSLIM breakout charts)
https://twitter.com/RayTL_
https://twitter.com/duckman1717
https://twitter.com/PradeepBonde
4) BROKER:
- Personally, I use InteractiveBrokers. They offer trading with $0 commission fees as well as $0 ticket fees. Their margin fees are also the lowest I have found (~3%). Any commission free broker will do. I hear WeBull is recommended often. Robinhood will work, but because of matters of principle (from GME debacle), I would never personally give a penny to the company.
_____________________________________________